Multimedia Artist & Designer
![]()
Tangible Product Design,
Interactive Installation,
Museum Experience Design
Art Practice
Time-based Media,
Installation, Sculpture
Chaosphere
Mar 2024
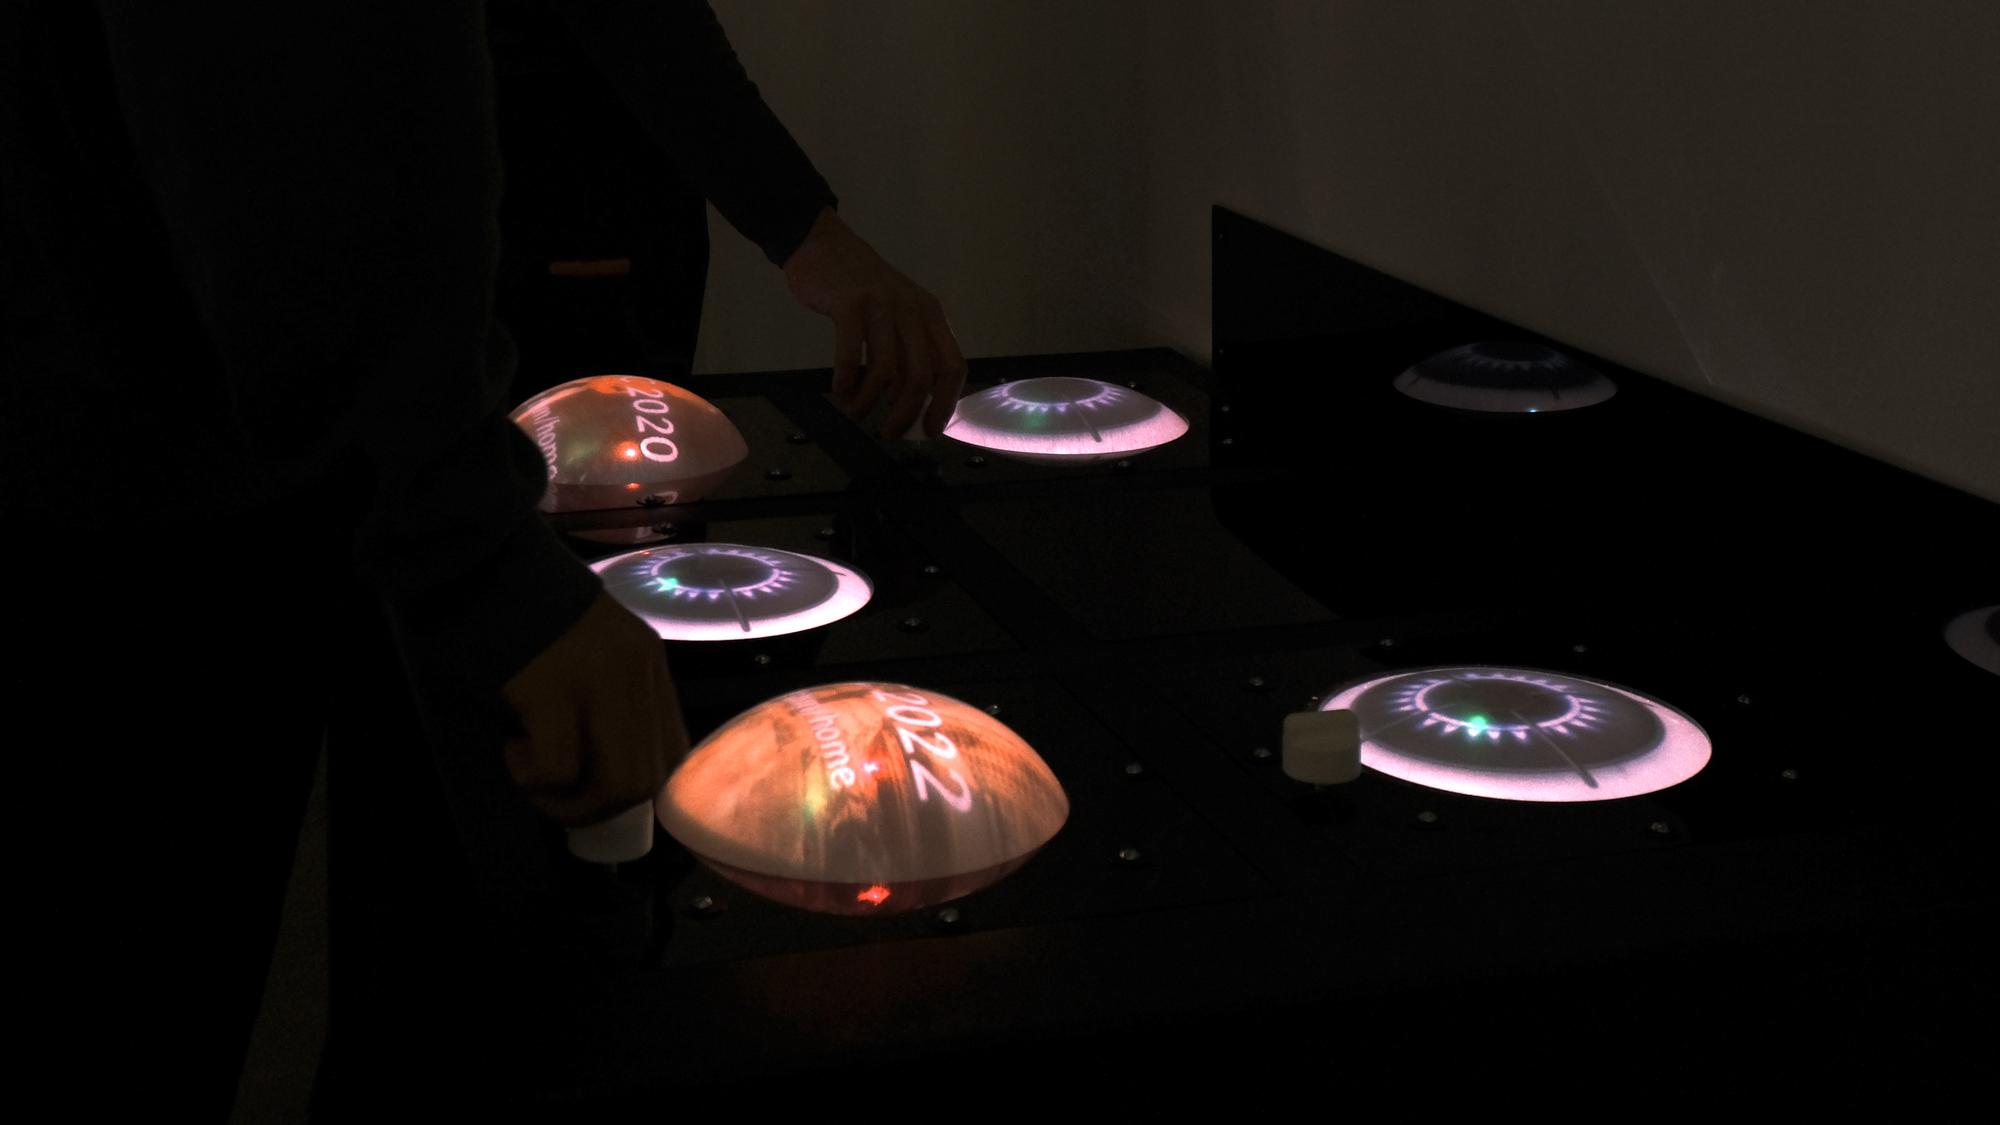
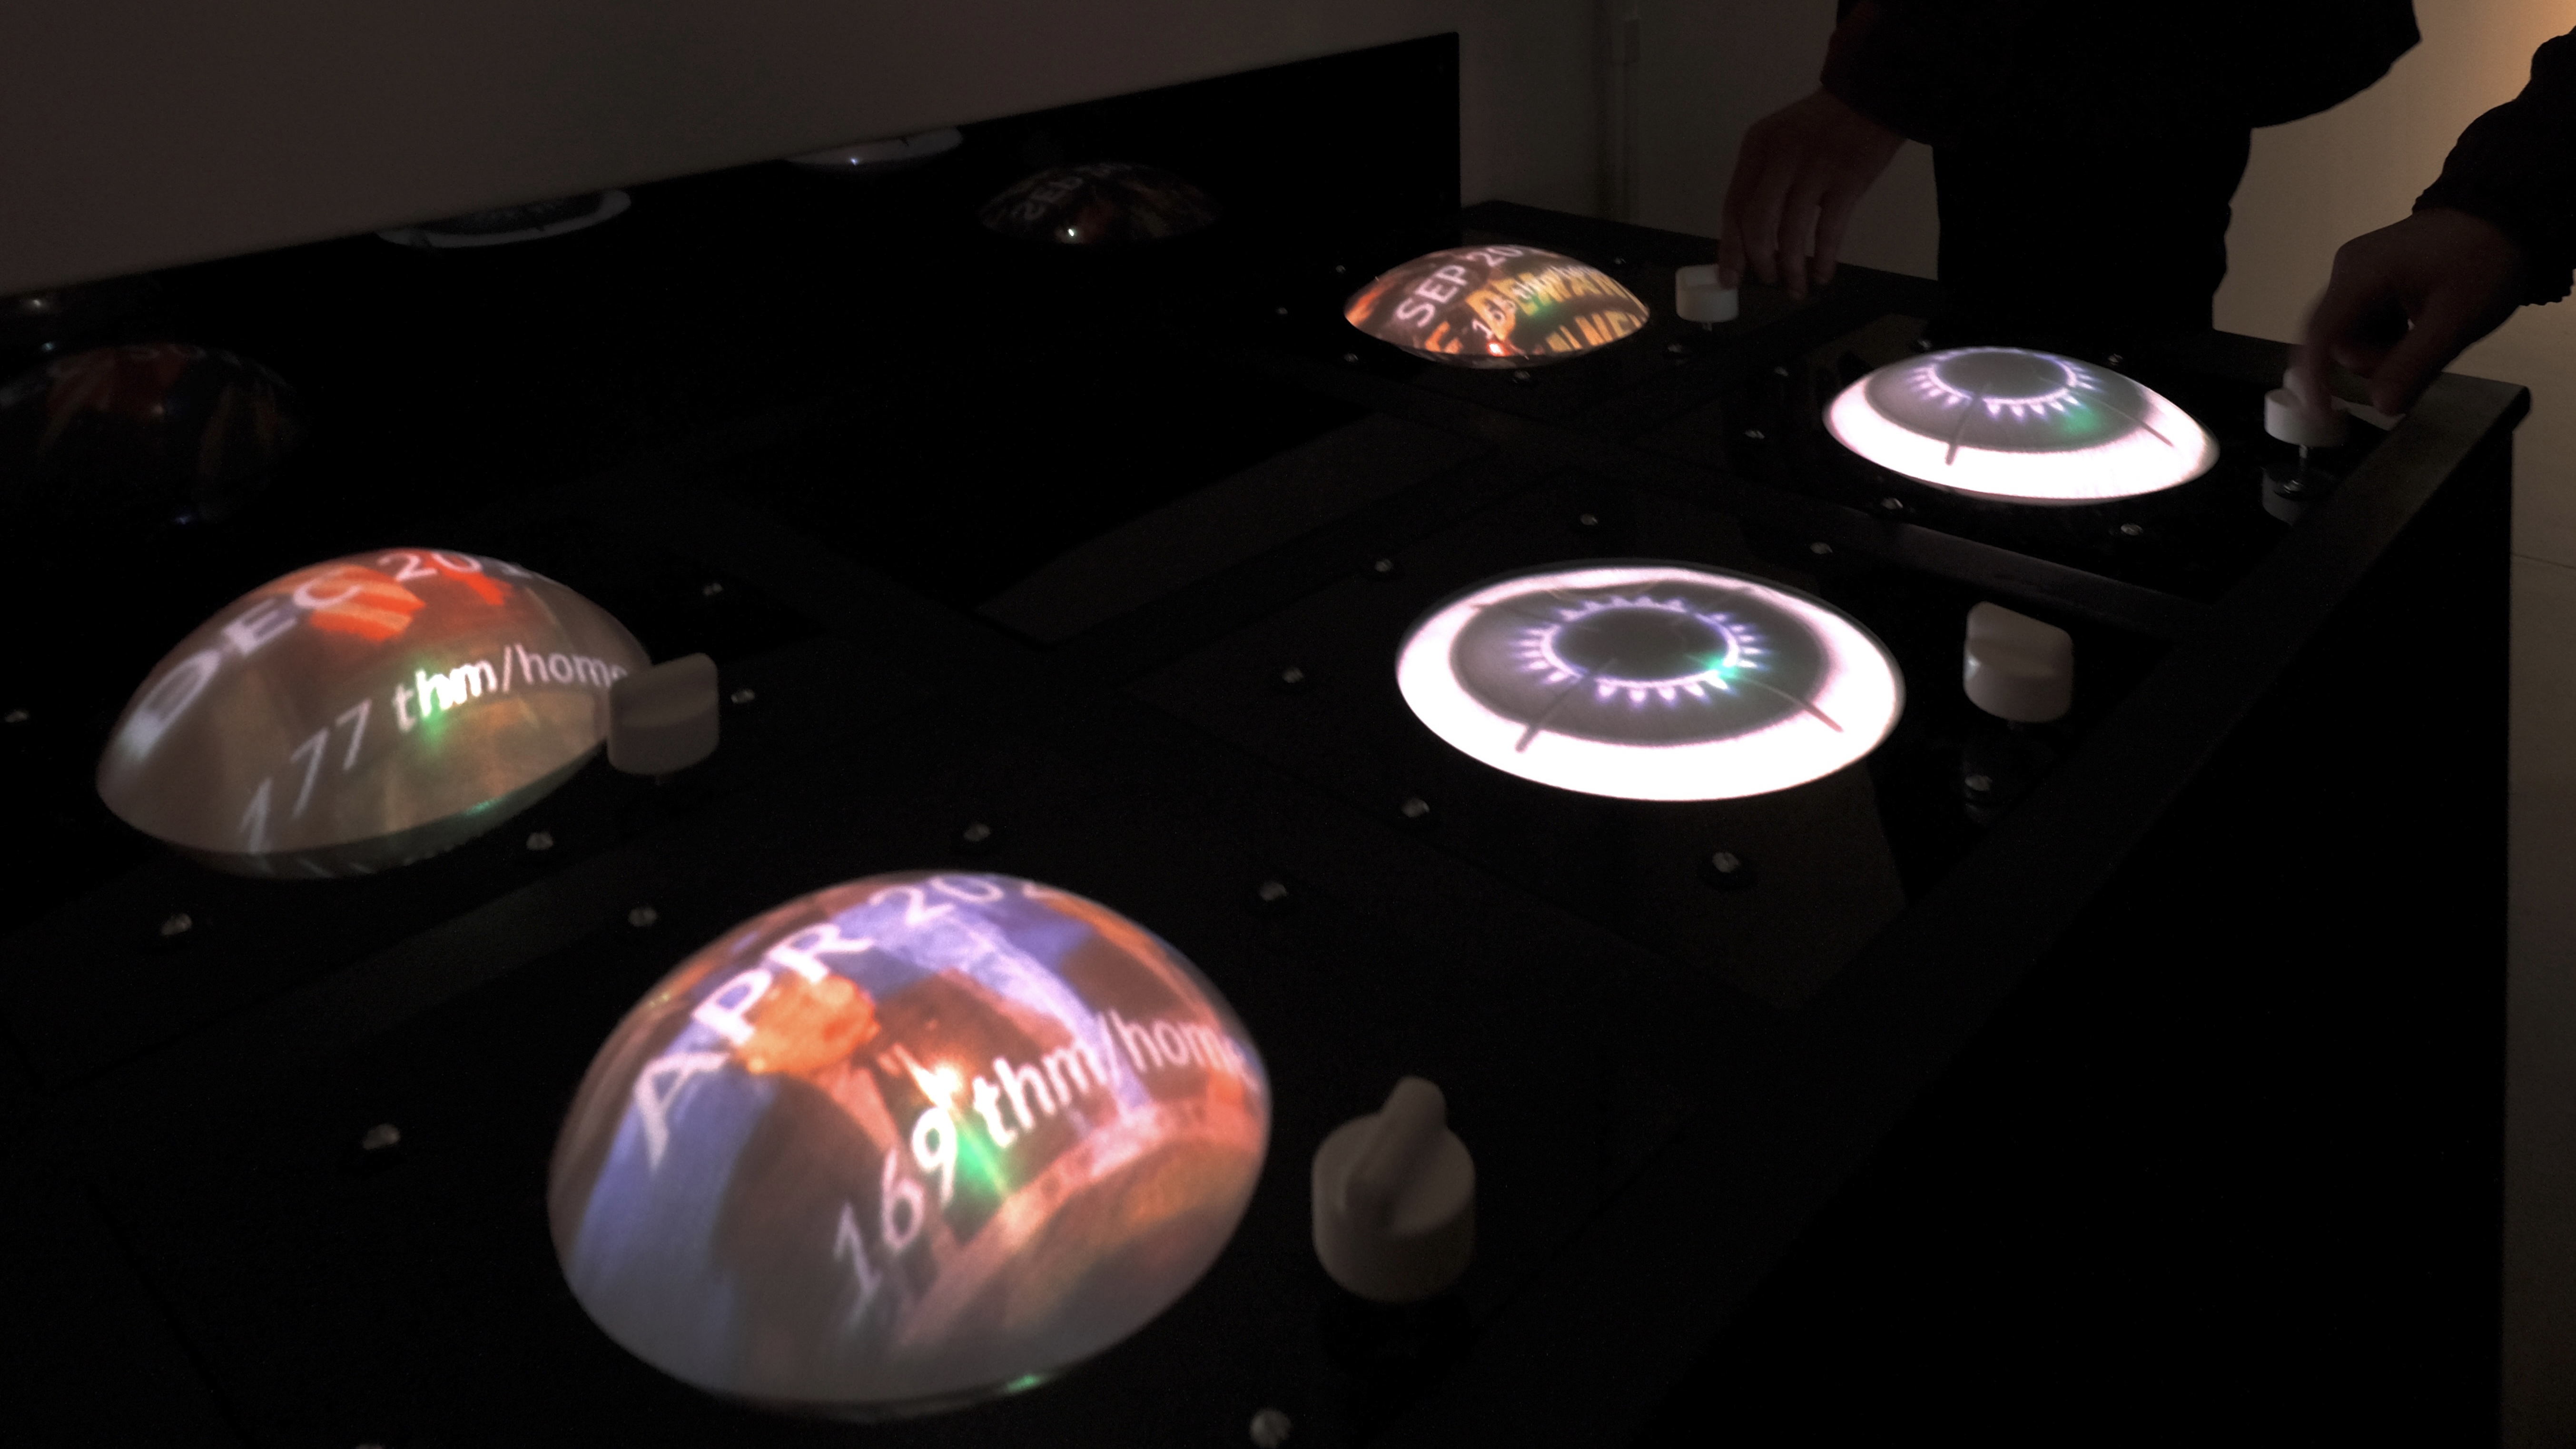
Chaosphere is an interactive data visualization installation that looks at yearly trends in cooking gas usage in New York City. Through interacting with the inflatable burners on a stove, participants will look at monthly gas usage as well as brief video compilations of the related triumph, controversy, and hardship experienced by the human race in recent years. The piece uses cooking as a starting point to examine the tension between the aftermath of a chaotic world and the essence of living, fertility, and community.
This piece is a commission project for the Data Through Design 2024 (read more) exhibition at BRIC, Brooklyn, New York.
Collaborate with Zongze Chen, Angel Mai, and Sharell Bryant
My Role
Design, Digital and
Physical Fabrication
Key Technologies
Arduino
Max
Data Visualization
Real-time Projection Mapping
Context & Design︎︎︎
The cooking and preparation of food have historically served as a site of communion; changes in patterns of usage around the changing of seasons, the passing of years, and pre- and post-COVID times can illuminate subtle patterns in domestic life. The passage of time is visualized by fluctuations in the size of the inflatable spheres, as well as changes in projection mapping, resulting in a vibrant interactive experience that recreates the abstract emotional realities of changing times. Such visuals will be designed with major historical, cultural, and political moments in mind, utilizing sounds, images, and news clips that recall the sociological atmosphere of the time, such as the House’s Gas Stove Protection and Freedom Act passed earlier this year, which stirred up criticisms of misplaced legislator priorities. With the constancy of the hearth as communion, we invite strangers to join us in observing the turmoil of public life from within the intimacy of the private sphere.
Design︎︎︎
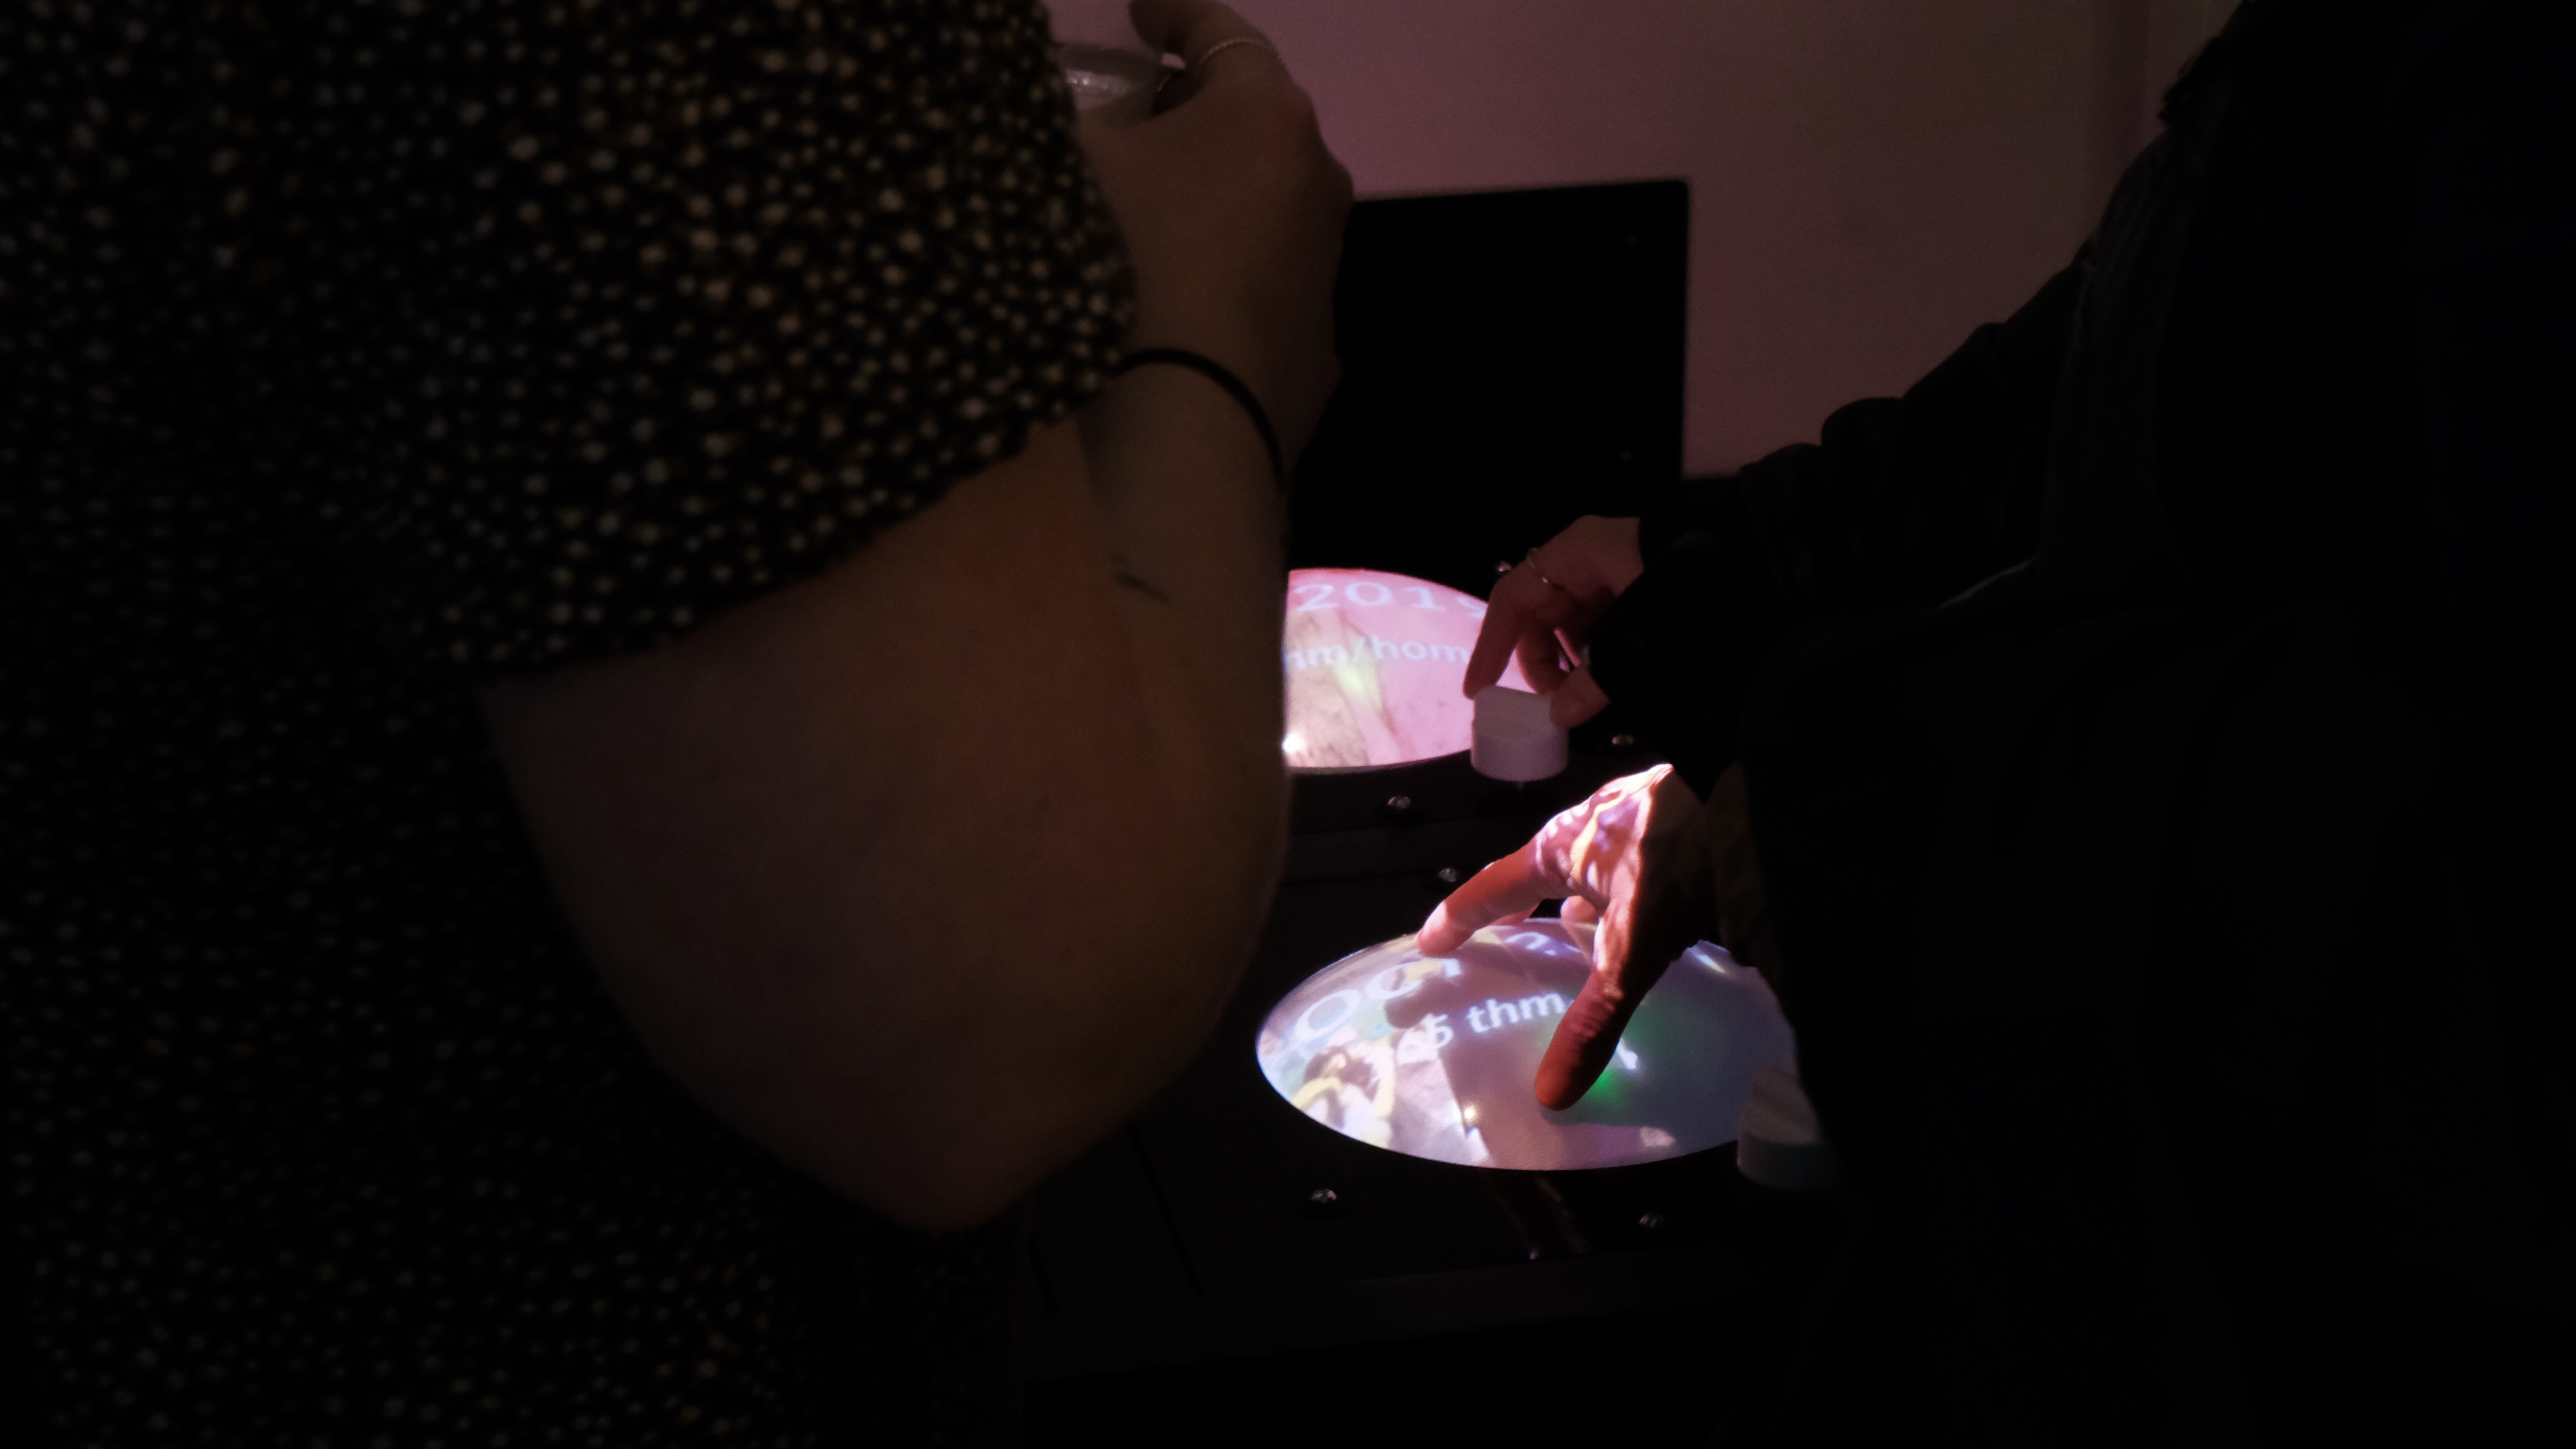
The setup looks like a standard kitchen stove with 5 burners with knobs respectively. Each burner is mounted with an inflatable silicon surface and represents one year of cooking gas usage data (2018 - 2023) through projection mapping from the project mounted from the wall. When viewers approach a burner, they will turn on the knob. Corresponding to the knob position, the surface will start to inflate, and the projector will project the usage of cooking gas monthly accompanied with major events that happened during the month on the inflating surface. The volume of the inflatable reflects the actual amount of gas being used (summer with lower gas consumption, winter with higher gas consumption).
Process︎︎︎
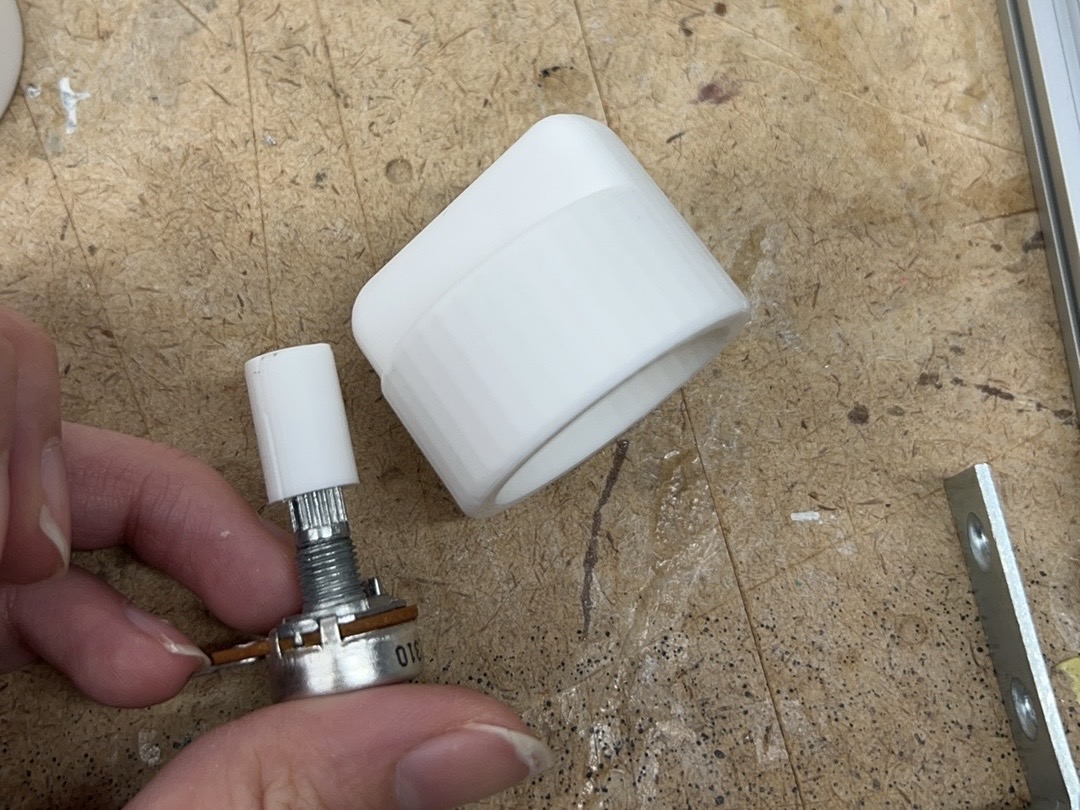
My main responsibility in the group is fabrication. The images below show the whole process of design, prototype, and assemble of the project. We brought a readymade table from IKEA and I utilized the shaper to make a strove-like table top tailored for the simulated inflatable burner modules made of silicons and reflective acrylic boards to achieve the desired aesthetic and functionality. The burner control switch is precisely molded in Fusion 360 and 3D printed to fit the potentiometer that regulates the air pump responsible for inflating the silicon to ensure a smooth and intuitive interaction for viewers. 24 air pumps, other Arduino-related components, power strips, and a laptop controls the real-time projection mapping were hidden in the interior structure of the strove.
